Articoli

Adulti emergenti e influenza dei social netowrks

Una nuova fase di sviluppo, gli adulti emergenti

Il cambiamento socio-culturale degli ultimi vent’anni ha provocato mutamenti profondi in ogni sfera di vita. La globalizzazione, nei paesi industrializzati, ha fatto sì che i ragazzi nati nell’ultima decade degli anni ‘90 crescessero in un contesto storico-culturale notevolmente diverso rispetto a quello dei loro genitori. La globalizzazione ha portato con sé l’avvento della cosiddetta era digitale favorita dall’insediamento di Internet in ogni attività quotidiana. Parallelamente, i progressi nel campo dell’alimentazione e della salute hanno garantito un’aspettativa di vita maggiore in cui la formazione dei giovani, preliminare all’ingresso nel mondo del lavoro diventa sempre più lunga e specializzata. In risposta, l’assunzione dei ruoli cosiddetti “adulti” come il matrimonio e la ricerca di un lavoro a tempo pieno, è slittata in avanti concretizzandosi verso le fine dei vent’anni. Difronte a questo cambiamento epocale, lo psicologo americano Jeffrey Jensen Arnett (2000), ha teorizzato l’esistenza di un nuovo periodo di sviluppo l’Emerging Adulthood. Gli emerging adults vengono definiti come quella categoria di individui che dopo aver lasciato la fase di “dipendenza” dell’infanzia e dell’adolescenza, ma allo stesso non essendo ancora indipendenti a livello economico e prossimi alle responsabilità normative dell’età adulta, esplorano una varietà di possibili direzioni di vita in amore, nel lavoro e nella visione del mondo. Questo stadio di sviluppo è concettualizzato come “l’età delle esplorazioni d’identità, l’età dell’instabilità, l’età focalizzata sul sé, l’età del sentirsi nel mezzo tra l’età delle possibilità” (Arnett, 2014).  L’età adulta emergente è caratterizzata dalla percezione di non essere più adolescenti, ma allo stesso tempo non ancora adulti poiché, in molti casi, non si è finanziariamente indipendenti dalle famiglie (Arnett, 2000). Diviene, quindi, necessario valutare questo periodo di vita come uno stadio a sé stante, differente dagli stadi di sviluppo tradizionali presenti nell’immaginario comune. Questa fase della vita è caratterizzata da molti cambiamenti e scelte da effettuare, come ad esempio lasciare il liceo, andare all’università, formarsi nuove relazioni stabili, lottare contro la disoccupazione, cercare un nuovo lavoro, uscire di casa, pianificare di fare una famiglia, ecc. La persona deve trovare il proprio “ spazio nel mondo” e per riuscirci passa attraverso delusioni e fallimenti. Arnett (2000, 2001) ha identificato tre ulteriori fattori che sono peculiari per lo stadio di sviluppo in questione, che lo differenziano dall’adolescenza e dall’età adulta:

  • il numero di spostamenti e modifiche residenziali (Goldscheider, 1997);
  • l’esplorazione di identità;
  • una maggiore probabilità di impegnarsi in “comportamenti a rischio”.

L’emerging adulthood è caratterizzata dalle fasce d’età comprese tra i 18 e i 24 anni (earlier) e tra i 25 e i 30 (older) ed è culturalmente e socialmente determinato: sarebbe tipico della società industriale occidentale, in cui istruzione e formazione sono costituiti quasi normativamente dalle varie fasi che coinvolgono, tra le altre cose, la possibilità di provare numerosi corsi di formazione e di rinviare le responsabilità tipiche dell’età adulta. Gli emerging adults affrontano transizioni di vita (passaggio da un stadio all’altro) determinanti, come quelle dalla scuola superiore all’università o, più avanti, dall’università al lavoro e questo può essere motivo di forti turbamenti. Le società industriali occidentali hanno permesso un utilizzo diffuso degli strumenti di Internet per semplificare la vita delle persone e velocizzarne i processi. Risulta interessante indagare come effettivamente la Rete è in grado di supportare gli emerging adults nelle loro attività e quali sono i fattori che permettono all’utente di godere delle sue risorse o al contrario di sviluppare un processo di strumentalità inversa.


© Emerging adults ed utilizzo di Internet: organo funzionale o strumentalità inversa? – Andrea Pivetti


Utilizzo di Internet: introduzione

Abstract

L’utilizzo di Internet è in grado di influenzare la vita degli utenti condizionandone abitudini e comportamenti. La seguente ricerca indaga quei fattori come supporto sociale, autostima, mindfulness ecc. in grado di indirizzare l’utente verso un suo uso funzionale o problematico della Rete.

All’indagine hanno partecipato 807 emerging adults, individui che si trovano in una fase della vita di grande instabilità dovuta all’uscita dal periodo adolescenziale per affacciarsi nella prima età adulta. Questo comporta la costruzione di nuovi legami e l’assunzione di nuove responsabilità. A riguardo è stata valutata l’influenza dei Social Network Sites (SNS) nel fornire un utile supporto per affrontare queste delicate transizioni di vita. La ricerca si focalizza anche sulla sfera negativa dell’utilizzo di Internet distinguendo tra uso problematico e dipendenza, facendo luce sui fattori di rischio. I partecipanti allo studio hanno risposto ad un questionario online in italiano, diffuso attraverso i Social Network Sites (SNS) con la collaborazione dell’Università di Bologna. I risultati dimostrano come gli individui che godono di un basso supporto sociale nella vita reale per colmare questa lacuna lo ricercano online. Questo aspetto a sua volta predice la possibilità di incorrere in un uso problematico di Internet (PIU). In questa situazioni l’individuo può arrivare a preferire le interazioni sociali online piuttosto che quelle faccia a faccia. Parallelamente è stato dimostrato come un basso livello di mindfulness sia correlato all’uso problematico di Internet (PIU). Tra gli strumenti della Rete, i Social network Sites (SNS) sono ampiamenti diffusi tra gli emerging adults ed è emerso come un uso frequente di Facebook sia correlato ad una bassa autostima. Allo stesso tempo, però, l’uso di Facebook predice lo sviluppo di capitale sociale, importante risorsa in grado di aiutare gli emerging adults durante le transizioni tipiche di questa età.

Introduzione

 Il lavoro prende spunto da alcuni studi sul rapporto tra vita reale (offline) e vita in rete (online) delle persone. Il tema è molto attuale e riveste una grande rilevanza sociale considerando l’uso diffuso di Internet ai giorni nostri, sia per motivi lavorativi o di studio, sia per semplice piacere personale. Per questa ragione risulta interessante comprendere l’influenza che può avere l’utilizzo della Rete sulla vita delle persone analizzando le connessioni che scaturiscono tra la vita offline e quella online. Il tema riveste anche una buona rilevanza scientifica, come dimostra il grande numero di studi effettuati negli ultimi dieci-quindici anni. Queste ricerche hanno potuto individuare, tra le altre cose, i fattori che conducono gli individui a fare un uso problematico di Internet (PIU) trascurando le sue risorse positive. Il seguente lavoro si focalizza principalmente sugli aspetti negativi legati all’utilizzo della Rete i quali possono scaturire, nei casi più estremi, nello sviluppo di una vera e propria dipendenza comportamentale di carattere patologico. Lo studio è rivolto ad una circoscritta fascia d’età, quella degli emerging adults, che si snoda tra i 18 e i 30 anni di vita. Questa delicata fase di sviluppo, come dimostrato dalla letteratura, è caratterizzata da varie transizioni di vita per le quali l’utilizzo di Internet e dei Social Network Sites in particolare, può fornire delle utili risorse in grado di aiutare gli individui ad affrontare delicate sfide di sviluppo. Lo studio si pone l’obbiettivo di dimostrare che determinati fattori personali generano specifiche situazioni che mediano l’utilizzo funzionale o disfunzionale di Internet da parte dell’utente. Nel primo capitolo si descrivono inizialmente le caratteristiche del periodo di sviluppo. In seguito si analizza il ruolo che svolge Internet ed in particolare i Social Network Sites (SNS) nel fornire possibilità di aiuto per superare le numerose sfide che costellano l’emerging adulthood. Nel secondo capitolo si analizzano quei fattori che hanno un effetto diretto sull’approccio degli utenti verso gli strumenti della Rete. In base a certe caratteristiche l’individuo è portato ad utilizzare Internet funzionalmente ai proprio scopi o in maniera disfunzionale. Nell’ultimo capitolo ci si focalizza sulle parte negativa dell’utilizzo della Rete distinguendo tra utilizzo problematico (PIU) e dipendenza da Internet.


© Emerging adults ed utilizzo di Internet: organo funzionale o strumentalità inversa? – Andrea Pivetti


10 strategie per rendere felice i dipendenti

10 Strategie per rendere felici i dipendenti

Dagli esperti nelle risorse umane arrivano 10 consigli per favorire il benessere e la felicità dei lavoratori, migliorando rendimento e produttività.

Il benessere e la soddisfazione dei lavoratori paga, sempre. Per i manager delle risorse umane fare in modo che i dipendenti siano “felici” è un punto di partenza, più che un obiettivo, finalizzato a potenziare il rendimento dell’azienda.

Ma di cosa hanno bisogno i lavoratori per essere felici?

Esistono vari modelli di welfare aziendale, anche molto innovativi, tuttavia secondo gli esperti in HR basta focalizzare l’attenzione su poche ma fondamentali iniziative – che non richiedono ingenti investimenti – volte a migliorare la vita in ufficio e, soprattutto, favorire la conciliazione tra carriera e privato.

  1. Offrire spazi per la crescita: per i lavoratori è fondamentale sapere di avere la possibilità di avanzare nella carriera, con numerosi benefici per la produttività e il rendimento in ufficio.
  2.  Offrire un buon programma di formazione: attivare progetti formativi aziendali favorisce non solo l’effettivo miglioramento delle competenze, ma anche una il potenziamento della soddisfazione e dell’autostima dei dipendenti.
  3. Concedere piccoli bonus: i premi aziendali, anche di piccola entità, contribuiscono a rendere i lavoratori più motivati.
  4. Concedere autonomia ai lavoratori: una maggiore autonomia nella gestione delle proprie mansioni, o degli orari di lavoro, rappresenta una notevole dimostrazione di fiducia da parte del datore di lavoro.
  5. Creare un ambiente favorevole in ufficio: se i rapporti tra colleghi sono sereni anche la produttività aziendale ne gioverà.
  6. Promuovere il telelavoro: nonostante ci siano varie scuole di pensiero in merito al rapporto tra lavoro da casa e produttività, consentire ai dipendenti (se richiesto) di svolgere una parte delle loro mansioni da casa potrebbe rappresentare un ottimo incentivo per migliorare le proprie prestazioni lavorative.
  7. Favorire la concentrazione dei lavoratori: stop alle comunicazioni inutili (via email, ad esempio) che rischiano di rallentare il lavoro e far perdere la concentrazione.


Fig. 6 – Un esempio di personale soddisfatto – http://2.bp.blogspot.com/-0BQ5rLY_UAY/UVDJFCNmxWI/AAAAAAAAAZo/-4TZ_Xll-28/s1600/aziende-dove-si-lavora-meglio.jpg

  1. Offrire un pacchetto unico di benefici: gli esperti in HR consigliano di predisporre specifici “pacchetti di servizi” a favore dei dipendenti, ad esempio voucher finalizzati a favorire i servizi di cura (baby sitting, assistenza ai familiari anziani e simili).
  2. Aiutare i lavoratori a vivere uno stile di vita sano: le aziende dovrebbero investire il più possibile nella salute e nel benessere dei propri lavoratori.
  3. Concedere brevi ma salutari pause dal lavoro: lasciare ai dipendenti un po’ di tempo libero, per navigare su Internet o dare un’occhiata a Facebook, rappresenta un ottima strategia per migliorare il loro rendimento.


© Chiedimi se sono felice:Analisi del Clima Organizzativo e del suo effetto sulle risorse umane – Dott.ssa Sonia Barbieri


[1] http://www.manageronline.it/articoli/vedi/8065/10-strategie-per-rendere-felici-i-dipendenti/

La motivazione

LA MOTIVAZIONE

La motivazione può essere definita come l’espressione dei motivi che portano un individuo a compiere una determinata azione. Essa dipende da due elementi: le competenze, cioè ciò che l’individuo è in grado di fare, ed i valori personali, ovvero ciò che l’individuo vuole fare. La spinta motivazionale inizia ogni volta che l’individuo avverte un bisogno, cioè quando percepisce uno squilibrio tra la situazione in essere e una situazione desiderata. Il bisogno è quindi uno stato di insoddisfazione che spinge l’uomo a procurarsi i mezzi necessari per porvi fine o limitarlo.

Nelle organizzazioni la motivazione dei collaboratori è una variabile strategica per l’impresa: rappresenta l’insieme degli scopi che spingono una persona ad agire e a mettere in atto un comportamento in direzione dei valori e degli obiettivi aziendali da raggiungere. Motivare i propri dipendenti significa quindi aumentarne la produttività e trattenere i talenti migliori.

Tutte le aziende, che siano ben organizzate o meno, si ispirano a dei valori, con l’auspicio che questi siano condivisi da tutte le persone coinvolte nei processi aziendali. I valori creano motivazione, perché danno identità sia all’azienda che anche al singolo lavoratore, se condivisi. I valori danno la consapevolezza di condividere non semplicemente un luogo di lavoro o degli obiettivi, ma qualcosa che va oltre il tempo e oltre il ruolo che si ha in azienda. Molto spesso capita invece che si lasci spazio all’autonoma interpretazione dei dipendenti, creando uno scostamento fra l’aspettativa dell’azienda e ciò che le risorse realmente esprimono.


© Chiedimi se sono felice:Analisi del Clima Organizzativo e del suo effetto sulle risorse umane – Dott.ssa Sonia Barbieri


Indicatori del benessere organizzativo

INDICATORI DEL BENESSERE ORGANIZZATIVO


La qualità del personale è il primo tassello da far quadrare per ottenere performance migliori, pertanto per poter trovare personale preparato bisogna innanzitutto operare scelte oculate nel mercato del lavoro. Un altro passo importante consiste nel far acquisire al proprio personale un maggior senso di appartenenza alla struttura aziendale, e saper trasmettere le motivazioni giuste. In tale contesto migliora anche la comunicazione interpersonale, necessaria per la trasmissione di informazioni utili per il lavoro e per l’utenza.

Sono di primaria importanza la formazione e l’aggiornamento delle capacità lavorative, legati non solo all’ambito lavorativo nel quale si è posti, ma estendendo le conoscenze anche in altri campi, favorendo una professionalità trasversale utilissima in caso di un cambiamento radicale all’interno della propria organizzazione.

Nell’ambito, quindi, delle caratteristiche e delle necessità dell’organizzazione del personale, si inserisce l’analisi del Benessere Organizzativo: la capacità di un’organizzazione di promuovere e di mantenere il più alto grado di benessere fisico, psicologico e sociale dei lavoratori in ogni tipo di occupazione.

I maggiori indicatori da considerare ed analizzare sono, tra quelli positivi: la , la collaborazione, la leadership, la comunicazione efficace; tra quelli negativi: il mobbing, lo stress lavoro correlato, il burnout.


© Chiedimi se sono felice:Analisi del Clima Organizzativo e del suo effetto sulle risorse umane – Dott.ssa Sonia Barbieri


Emergency Evacuation: Discussion

Emergency Evacuation: Discussion


The aim of this exploratory pilot study was to shine a light on the resource of leadership during an emergency situation. For this reason we proposed some hypothesis that regard connections between some variables that we believe can play an important role during emergencies. We took into account transformational leadership, knowledge about the emergency plan, positive attitude toward emergency plan, self-confidence and the team emergency response.

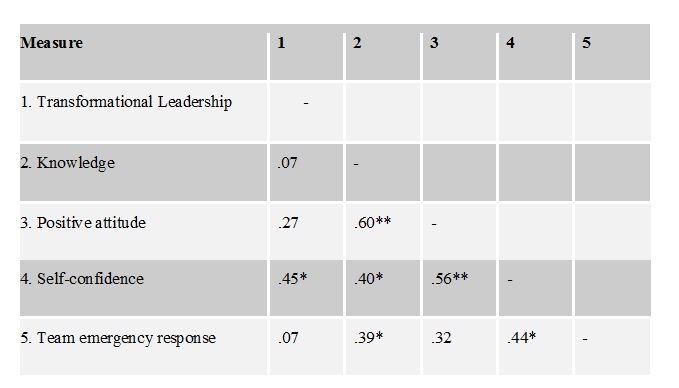
As predicted by hypothesis 1, higher levels of transformational leadership correspond to higher levels of self-confidence. The significant positive correlation we found supports our idea that transformational leaders will feel confident also during the emergency situation.

Also hypothesis 2 has been confirmed. Indeed, the statistical analysis shows that leaders who have a deeper knowledge about the emergency plan report higher levels of self-confidence. This means that being familiar with the procedures to following in case of emergency allow leaders to feel more confident when the dangerous situation really takes place.

In the same way, having a positive attitude toward the emergency plan is another key variable that positively affects the level of self-confidence. In fact, the correlation analysis has shown that the hypothesis 3 received statistical support: if a leader thinks that the emergency plan is understandable and safe, he/she will feel more sure about how to lead the situation.

The level of self-confidence, at the same time, affects the team emergency response. The correlation matrix, indeed, shows that there is a statistically significant positive correlation between the self-confidence and the team emergency response (hypothesis 4). This means that self-confident leaders have a positive effect on their team members during the emergency, leading them to perform the most appropriate actions.

Moreover, the correlation matrix shows two other relationships that haven’t been taken into account in the research questions chapter. The first one is that positive attitude toward the emergency plan and knowledge about it are strongly positively correlated. This finding is not surprising. Indeed, only if a leader knows the emergency plan he/she will develop a positive attitude toward it, or, on the contrary, only if a leader thinks that the emergency plan is important he/she will be motivated to read and memorize it. The second relationship that emerged from the correlation matrix is that knowledge about the emergency plan is directly and positively correlated to team emergency response. This means that leaders who have a good level of knowledge about how to behave in case of emergency have a positive effect on the emergency performance of their teams, probably suggesting them the right things to do in order to face the hazard.

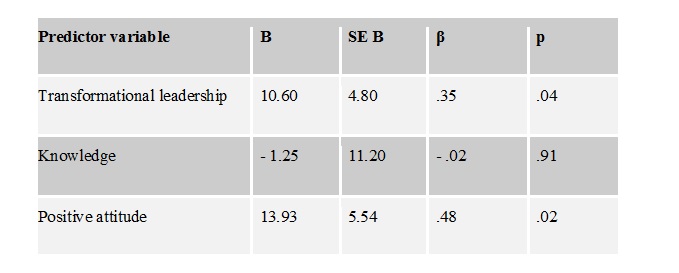
The model we proposed, with transformational leadership, knowledge about the emergency plan and positive attitude toward it predicting the level of self confidence hasn’t received support from the statistics analysis (hypothesis 5). Indeed, differently to what we thought, knowledge is not a significant predictor. On the other hand, transformational leadership and positive attitude received statistical support. Surprisingly, this means that knowing what to do in case of emergency doesn’t have a predicting effect on the level of confidence in leading the same emergency. Coherently with what we supposed, instead, leaders who adopt a transformational style of leadership and, at the same time, have a positive attitude toward the emergency procedures will experience higher levels of self-confidence during the emergency.

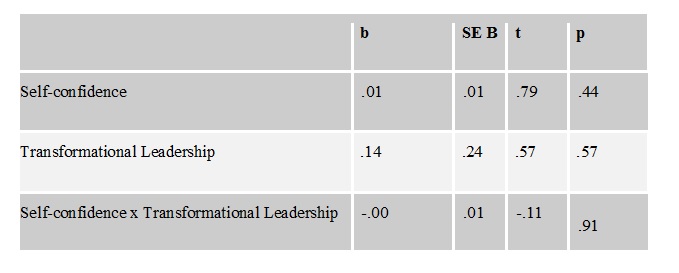
Not even hypothesis 6 has received statistical support. Indeed, there is no statistical significance for the moderator effect of self-confidence in the relationship between transformational leadership and team emergency response.  This could be due to the small sample we used for this pilot study, or maybe truly there is not a significant effect between these variables. Nevertheless further researches are needed to give light to these topics, because there is a gap in the literature so far.

The descriptive analysis provided in this study depict a positive scenario of the emergency management in the organization considered.

Most of the immediate actions performed during the shock were pertinent with the ones suggested in the evacuation plan, like sheltering under the table. Also the team emergency response described by the leaders is positive: the most rated item regards the management of the situation as a team and the clarity of the leadership role. Less than the half of the participants reported that they needed to encourage someone which wasn’t calm and only a quarter of them had to convince someone to leave the building. These are both good indicators of the members performance. Team evacuation behavior can be also be considered positively: the items that received the higher rates regard the safely use of emergency exit in a reasonable time. Most of the leaders reported to have only a little bit of difficulties in leading the situation, and the mean of the self-confidence level was quite high (almost 70%). Results are really positive also taking into account leaders’ knowledge about the emergency plan (the mean of each itemis over 2.46 on a maximum of 3), and leaders’ attitude about it, which is quite positive (the mean of each item is over 3 on a maximum of 4). Moreover, asking about the effectiveness of a list of actions, the answers are pertinent with what the emergency plan recommends. Finally, drills are perceived quiet important or extremely important by eight out of ten leaders.

All this descriptive data enrich our comprehension of the situation happened in the organization we considered as well as this study that aimed to give a description and clarify the leader’s perspective during an emergency evacuation. Nevertheless, there are some limitations that affect this research.

The first one regards the number of participants which is too small. For this reason it could be useful to repeat the study with a bigger number of respondents and retest the 5th and 6th hypothesis that haven’t be statistically supported. It could be also interesting to collect participants from different firms and companies instead that from the same organization.

Another weakness of this paper is that leaders’ knowledge about emergency plan is assessed through questions to the leaders so the measure couldn’t be objective. It would be better to assess their level of knowledge through another questionnaire. For example, it could be more objective to verify if the respondents really know the content of the emergency plan (for example “according to the evacuation plan, where is the nearest emergency exit from your office?”), instead of asking the level of the agreement on the item “I know the emergency plan in case of evacuation”.

Also other type of variables present the same problem of objectivity. Team emergency and team evacuation response are assessed through questions to the leaders, so the measure could not be completely reliable. Also in this case it would be better to use another specific questionnaire able to assess objectively the level of team emergency and evacuation response. As an alternative these variables can be also assessed through some specific drills. Another idea could be to distribute these two scales to a sample of teams’ members as well and then confront their answers to leaders’ ones.

Finally, another factor that has to be taken into account is that social desirability bias is it likely to affect our data. This is because our sample is composed of managers and leaders that can be motivated to answer in a way to ingratiate the company or the employer, faking the results.

The present study is just an exploratory research, but it gives some interesting starting points that would be interested to be examined in depth. Further research is needed to clarify the questions raised in this report. For example, there are no studies analysis leadership in evacuation that take into consideration leadership styles. Also self-confidence is an aspect generally neglected in this field of study. Nevertheless, it is two factor are both involved during the evacuation process.

This study reaffirm, once again, the crucial importance of the psychological issues in evacuation management.  There are many questions that still have to be answered due to the complicated evacuation setting which involves individual, social and environmental factors. Nevertheless, continuing collecting data is of utmost importance to develop a comprehensive model of human behavior in evacuation. Psychological findings will be then added to engineering measures in the evacuation models that are really useful tools to predict time needed to exit buildings. Only with this synergy in efforts workers’ security in the workplaces would be pledged.


©  – MANAGEMENT OF AN EMERGENCY EVACUATION: A LEADER’S PERSPECTIVE – Sara Colangeli

Relationships between variables

Relationships between variables


Relationships between variables

We run a correlation to test the first fourth hypothesis.

Table 17

Correlation Matrix

Note. *p<.05, **p<.01

As shown in Table 17, transformational leadership and self-confidence are positively correlated, r(26)=.45, p<.05. So, hypothesis 1 can be confirmed. Also knowledge about the emergency plan and self-confidence are positively correlated, r(29)=.40, p<.05 (hypothesis 2). Hypothesis 3, as well, can be confirmed, because the table shows a strong positive correlation between positive attitude toward emergency plan and self-confidence, r(28)=.56, p=.01. As it was supposed in hypothesis 4, also self-confidence and team emergency response are positively correlated, r(28)=.44, p<.05. Moreover, the table shows another relationship that we haven’t supposed at the beginning of this study. Indeed, also knowledge about the emergency plan and team emergency response are positively correlated, r(33)=.39, p<.05. Finally, another interesting finding not considered in the hypothesis is that also positive attitude and knowledge are strongly positively correlated, r(34)=.60, p<.01.

Predictors of self-confidence

A multiple regression analysis was conducted to predict the level of self-confidence from theknowledge about the emergency plan, the positive attitude toward it and the transformational style of leadership. We considered self-confidence as a criterion and knowledge, positive attitude and transformational leadership as predictors. Results are reported in Table 18.

Table 18

Multiple Regression Analysis (dependent variable: self-confidence)

Note. R²=.65.

For this model, both the transformational leadership t(24)=2.21, p<.05 and the positive attitude t(24)=2.51, p<.05 are significant predictors of the team emergency response. On the other hand, knowledge t(24)= -.11, p=.91 resulted not significant. The relationship between the two predictors and the criterion is positive, meaning that is the level of transformational leadership or of the positive attitude rises, also the level of team emergency response will grow. Moreover, looking at the Bs, we can also notice that the positive attitude has a bigger impact (B=13.93) than the transformational leadership (B=10.60). The overall model, with the three predictors, is able to account for the 65% of the variance in the level of self-confidence.

So, the result provides partial confirmation for the hypothesis 5.

Self-confidence’s moderation effect

We tested the moderator effect of self-confidence between transformational leadership and team emergency response using a regression analysis. Results are reported in Table 19.

Table 19

Moderation Analysis (dependent variable: team emergency response)

Note. R² = .13

Looking at the last column, we can see that the interaction between the two variables is not statistical significant (p=. 91). So we are not able to confirm that the strength of the relationship between transformational leadership e team emergency response is affected by the level of self-confidence (hypothesis 5).


©  – MANAGEMENT OF AN EMERGENCY EVACUATION: A LEADER’S PERSPECTIVE – Sara Colangeli

Leadership, Creativity & Innovation: RESULTS

Leadership, Creativity & Innovation: RESULTS

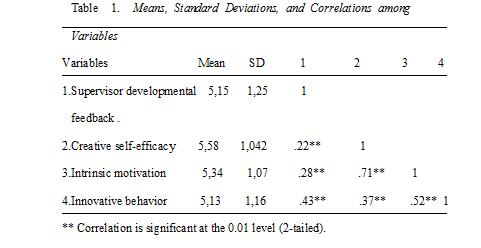
Table 1 displays means, standard deviations, and inter correlations among all study variables.

Table  1.

** Correlation is significant at the 0.01 level (2-tailed).

CONSTRUCT VALIDITY.

According to Bartlett’s test, the matrix is not an identity matrix. The null hypothesis is rejected. The variables under analysis are correlated, thus factor analysis is justified. The Cumulative percentage is 61. 139. Four factors explain 61.139% of common variance.


Besides the reversed item of supervisor developmental feedback, all of the variables had values higher than 0.4. It had no loading on any factor that made weaker the correspondence between the structure of a set of indicators and the construct it measures.

RELIABILITY

Alpha Cronbachs for almost all of the measures were higher than .70. Removal of any item or set of items in any measure did not appreciably improve estimates of internal consistency. So, all the variables used in the research were internally consistent.  Separately measured they registered high alpha coefficients.

In the table below the alpha coefficients are presented for all of the variables.

A reversed item, supervisor developmental feedback, turned out to have slightly higher value than Alpha coefficient.  Nevertheless, a review of all of the scales together reveals that a high reliability was registered (.913).

GUIDE FOR TESTING THE METIATION EFFECTS IN MULTIPLE REGRESSION

To test the mediating effect, multiple regression analysis was run to analyze the relationship among all of the variables by first regressing the dependent variable on the independent variable, then regressing the mediator on the independent   variable, and finally regressing the dependent on both the independent variable and the mediator variable ( Baron & Kenny, 1986).

According to the authors (Baron & Kenny, 1986; Judd & Kenny, 1981) there are four steps  in establishing that a variable (intrinsic motivation) mediates the relation between a predictor variable and the outcome variable :  by first step is shown that there is a significant relation between the predictor and outcome. The second step is to show that the predictor is related to the mediator. Third step is to show that the mediator (intrinsic motivation) is related to the outcome variable (innovative behavior). The final step is to show that the strengths of the relation between the predictor and the outcome is significantly reduced when the mediator is added to the model.

Hypothesis 1: Supervisor developmental feedback is positively related to innovative behavior through the mediating role of intrinsic motivation.

Table 1

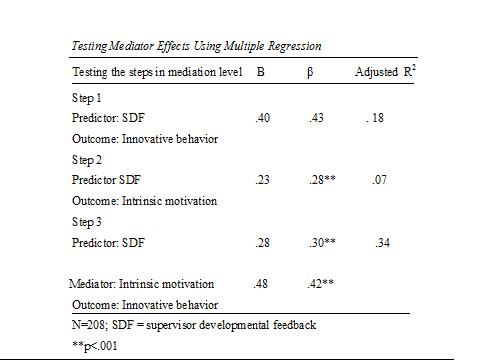
Table 1 provides the results of analysis to test the meditational hypothesis. The unstandardized regression coefficient (.40) related to the effect of supervisor developmental feedback was significant. (p<.0001). Thus, the supervisor developmental feedback and the requirement for the mediation in step 1 was met.

As mentioned above mediator variable (intrinsic motivation) on predictor variable (supervisor developmental feedback) was regressed in step 2.

The unstandardized regression coefficient (B=.23) related with this relation also was significant at the p<.0001 level. Thus the condition for step 2was supported, supervisor developmental feedback was again significant.

Further, to test whether mediator variable (intrinsic motivation) was related to outcome variable (innovative behavior) we regressed the latter simultaneously on both (mediator) intrinsic motivation and predictor (supervisor developmental feedback).  The coefficient concerning the relation between intrinsic motivation and supervisor developmental feedback also was significant. (B= .28, p<.0001).  Thus, the condition for step 3 was again supported. (supervisor developmental feedback was significant).

This third regression equation also provided an estimate of the relation between predictor and outcome variable. If B equals zero in that relation, there is complete mediation. However, that path was .48 and still significant (p<.0001).

It means that the relationship between the predictor (supervisor developmental feedback) and the outcome variable (innovative behavior) is partially mediated by intrinsic motivation (B is greater than zero). Consequently, the relationship between predictor and outcome variables is significantly smaller.

To summarize, the analysis showed that intrinsic motivation has a mediating role between the independent (supervisor developmental feedback) and dependent variable (innovative behavior).

It has weak correlation with supervisor developmental feedback (.28), thus could maintain its mediating role in that relation. At the same time, supervisor developmental feedback and intrinsic motivation both registered good correlation coefficients with innovative behavior: .43 and .52 respectively.

Hypothesis 2:  Creative self-efficacy will be positively related to innovative behavior through the mediating role of intrinsic motivation

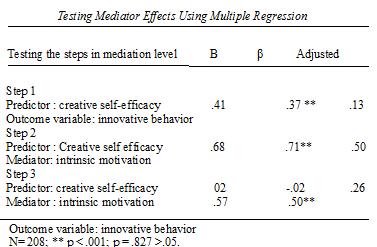
Table 2

Table 2 provides the results of analysis:

The unstandardized regression coefficient (B=.41) associated with the effect of creative self-efficacy was significant (p<.0001). Thus, creative self efficacy was significant and the requirement for the mediation in step 1 was met.

In the regression of the mediator (intrinsic motivation) on predictor (creative self-efficacy) in step 2 the unstandardized regression coefficient (B = .68) was also significant at the p<.0001 level, thus, the condition for step 2was met, creative self-efficacy was significant.

By regressing innovative behavior simultaneously on both mediator (intrinsic motivation) and the predictor (creative self-efficacy) we tasted whether intrinsic motivation was related to innovative behavior.  The regression coefficient associated with relation between intrinsic motivation and innovative behavior was significant (B=.57, p<.000 ) Thus, the condition for the step 3 was significant. However in the third step creative self-efficacy was insignificant (B=.02; p = .827 >.05).

Due to high correlation with intrinsic motivation (.711), creative self-efficacy got excluded from the model, since regression allows the variables that are in weak correlation with each other and have strong predictive power on the outcome variable.

In this case regression made insignificant the variable that had less (.37) predictive power on innovative behavior than the other variable, intrinsic motivation (.52).   The strong power of self-efficacy is expressed by the high correlation with intrinsic motivation that, in its turn, shows high predictive value on outcome variable: innovative behavior.

© Leadership, Creativity & Innovation in Enterprises – Dott.ssa Nune Margaryan

Leadership, Creativity & Innovation: MEASURES

Leadership, Creativity & Innovation: MEASURES

Supervisor developmental feedback:  Consistent with prior research (see Zhou, 2002), we used a 3-item scale to measure the supervisor developmental feedback (e.g., when my supervisor gives me feedback, it helps me to learn and improve my job performance; Cronbach a – .64).

For measuring self-efficacy, along the lines of Tierney and Farmer (2002), we have proposed four types of questions (e.g., I consider that I’m good at developing and presenting new ideas)  regarding employees’ self-efficacy beliefs about their activities (Cronbach a = .85).  For measuring intrinsic motivation, a 5-item scale as posited by Tierney, Farmer, and Graen, (1999) was used (e.g., I like to find solutions for complex problems; Cronbach a – .86).

On innovative behavior, we have proposed seven self-reported questions (e.g., we try to find new technologies, products, services and new methods for conducting the work; see Tierney, Farmer, & Graen, 1999) about employees’ innovative behavior (Cronbach a – .92).   A Likert-type scale ranging from 1, strongly disagree, to 7, strongly agree, was used to define the answers.

RESULTS

Table 1 displays means, standard deviations, and inter correlations among all study variables.

Table  1.  Means, Standard Deviations, and Correlations among Variables

CONSTRUCT VALIDITY

According to Bartlett’s test, the matrix is not an identity matrix. The null hypothesis is rejected. The variables under analysis are correlated, thus factor analysis is justified. The Cumulative percentage is 61. 139. Four factors explain 61.139% of common variance.

Total Variance Explained

Besides the reversed item of supervisor developmental feedback, all of the variables had values higher than 0.4. It had no loading on any factor that made weaker the correspondence between the structure of a set of indicators and the construct it measures.

RELIABILITY

Alpha Cronbachs for almost all of the measures were higher than .70. Removal of any item or set of items in any measure did not appreciably improve estimates of internal consistency. So, all the variables used in the research were internally consistent.  Separately measured they registered high alpha coefficients.

In the table below the alpha coefficients are presented for all of the variables.

A reversed item, supervisor developmental feedback, turned out to have slightly higher value than Alpha coefficient.  Nevertheless, a review of all of the scales together reveals that a high reliability was registered (.913).

GUIDE FOR TESTING THE METIATION EFFECTS  IN MULTIPLE REGRESSION

To test the mediating effect, multiple regression analysis was run to analyze the relationship among all of the variables by first regressing the dependent variable on the independent variable, then regressing the mediator on the independent   variable, and finally regressing the dependent on both the independent variable and the mediator variable ( Baron & Kenny, 1986).

According to the authors (Baron & Kenny, 1986; Judd & Kenny, 1981) there are four steps  in establishing that a variable (intrinsic motivation) mediates the relation between a predictor variable and the outcome variable :  by first step is shown that there is a significant relation between the predictor and outcome. The second step is to show that the predictor is related to the mediator. Third step is to show that the mediator (intrinsic motivation) is related to the outcome variable (innovative behavior). The final step is to show that the strengths of the relation between the predictor and the outcome is significantly reduced when the mediator is added to the model.

Hypothesis 1: Supervisor developmental feedback is positively related to innovative behavior through the mediating role of intrinsic motivation.

Table 1 provides the results of analysis to test the meditational hypothesis. The unstandardized regression coefficient (.40) related to the effect of supervisor developmental feedback was significant. (p<.0001). Thus, the supervisor developmental feedback and the requirement for the mediation in step 1 was met.

As mentioned above mediator variable (intrinsic motivation) on predictor variable (supervisor developmental feedback) was regressed in step 2.

The unstandardized regression coefficient (B=.23) related with this relation also was significant at the p<.0001 level. Thus the condition for step 2was supported, supervisor developmental feedback was again significant.

Further, to test whether mediator variable (intrinsic motivation) was related to outcome variable (innovative behavior) we regressed the latter simultaneously on both (mediator) intrinsic motivation and predictor (supervisor developmental feedback).  The coefficient concerning the relation between intrinsic motivation and supervisor developmental feedback also was significant. (B= .28, p<.0001).  Thus, the condition for step 3 was again supported. (supervisor developmental feedback was significant).

This third regression equation also provided an estimate of the relation between predictor and outcome variable. If B equals zero in that relation, there is complete mediation. However, that path was .48 and still significant (p<.0001).

It means that the relationship between the predictor (supervisor developmental feedback) and the outcome variable (innovative behavior) is partially mediated by intrinsic motivation (B is greater than zero). Consequently, the relationship between predictor and outcome variables is significantly smaller.

To summarize, the analysis showed that intrinsic motivation has a mediating role between the independent (supervisor developmental feedback) and dependent variable (innovative behavior).

It has weak correlation with supervisor developmental feedback (.28), thus could maintain its mediating role in that relation. At the same time, supervisor developmental feedback and intrinsic motivation both registered good correlation coefficients with innovative behavior: .43 and .52 respectively.

Hypothesis 2:  Creative self-efficacy will be positively related to innovative behavior through the mediating role of intrinsic motivation

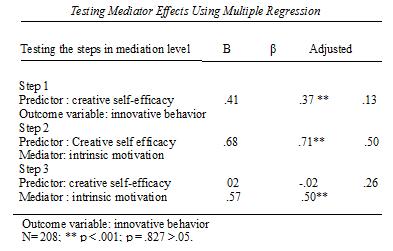
Table 2

Table 2 provides the results of analysis:

The unstandardized regression coefficient (B=.41) associated with the effect of creative self-efficacy was significant (p<.0001). Thus, creative self efficacy was significant and the requirement for the mediation in step 1 was met.

In the regression of the mediator (intrinsic motivation) on predictor (creative self-efficacy) in step 2 the unstandardized regression coefficient (B = .68) was also significant at the p<.0001 level, thus, the condition for step 2was met, creative self-efficacy was significant.

By regressing innovative behavior simultaneously on both mediator (intrinsic motivation) and the predictor (creative self-efficacy) we tasted whether intrinsic motivation was related to innovative behavior.  The regression coefficient associated with relation between intrinsic motivation and innovative behavior was significant (B=.57, p<.000 ) Thus, the condition for the step 3 was significant. However in the third step creative self-efficacy was insignificant (B=.02; p = .827 >.05).

Due to high correlation with intrinsic motivation (.711), creative self-efficacy got excluded from the model, since regression allows the variables that are in weak correlation with each other and have strong predictive power on the outcome variable.

In this case regression made insignificant the variable that had less (.37) predictive power on innovative behavior than the other variable, intrinsic motivation (.52).   The strong power of self-efficacy is expressed by the high correlation with intrinsic motivation that, in its turn, shows high predictive value on outcome variable: innovative behavior.


© Leadership, Creativity & Innovation in Enterprises – Dott.ssa Nune Margaryan